
Urban Climate Intelligence Platform
Mumbai's ward-level
heat vulnerability.
Satellite and population data, scored ward by ward.
Every number sourced.
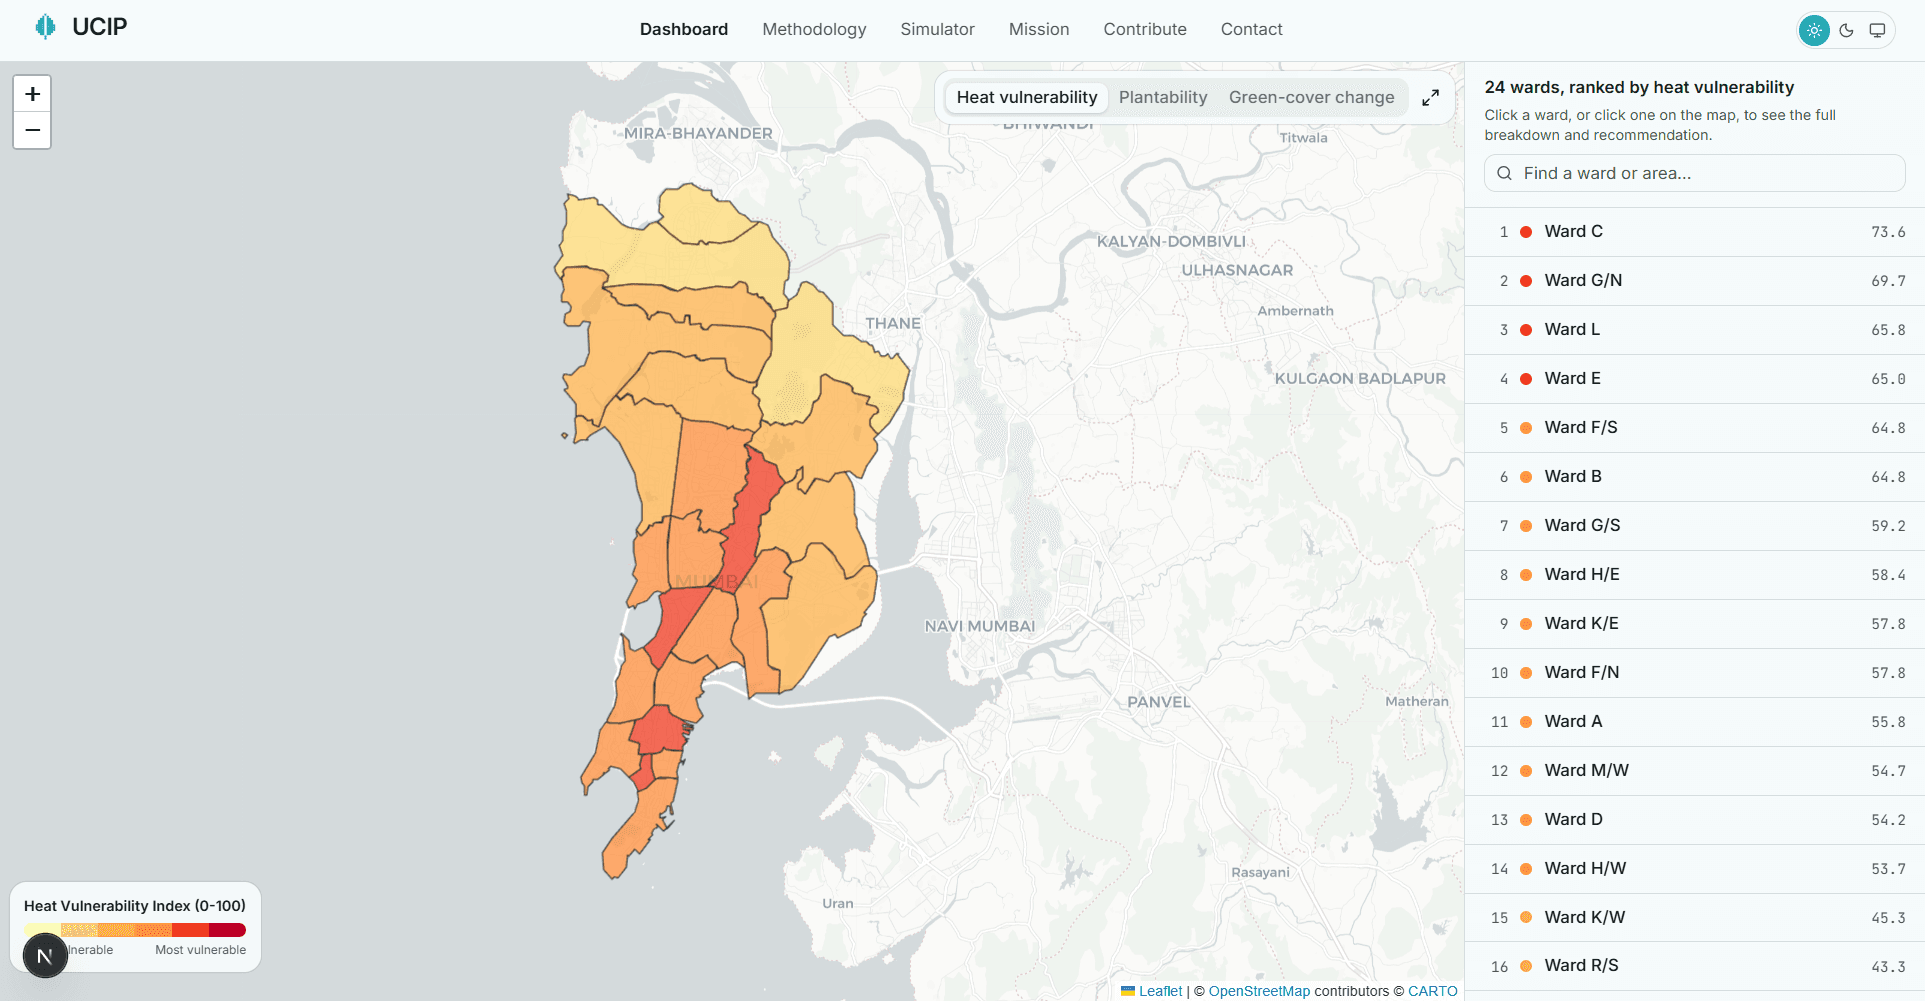
All 24 wards, raised and coloured by heat vulnerability.
Real BMC boundaries, coastline from Natural Earth.
Three ways to look at the city
Heat vulnerability
Every ward gets a score from 0 to 100 combining surface heat, green cover, crowding, elderly share, informal housing, and distance to hospitals. Darker red means help is needed sooner.
Plantability
Not every hot spot should get trees. This layer shows where planting makes ecological sense and where reflective cool roofs are the better fix.
Green-cover change
Satellite comparison against the 2016-17 dry season showing where the city has gained or lost vegetation.
The five wards that need cooling most
Computed from the latest satellite pass, not hand-picked.
- 1Ward CHVI 73.6
- 2Ward G/NHVI 69.7
- 3Ward LHVI 65.8
- 4Ward EHVI 65.0
- 5Ward F/SHVI 64.8
Not another heat map
Most tools stop at a map. UCIP turns a cited vulnerability score into a specific, ecologically-checked action for every ward.
Rank the wards, explain each score factor by factor, then recommend the right intervention, including rejecting tree-planting where it would backfire. Every step is traceable to published research.
Cited research
Every weight and coefficient traces to a published paper
The vulnerability index, the plantability filter, and the cooling estimates are all built on peer-reviewed work, 11 papers in total, each with a verifiable DOI.
Built in the open
All data sources are free and public: Landsat satellite imagery, WorldPop population rasters, OpenStreetMap, and municipal ward boundaries. The method, its weights, and its limitations are documented on the methodology page, including the parts that are proxies or estimates. This is a research prototype, not an official BMC tool.